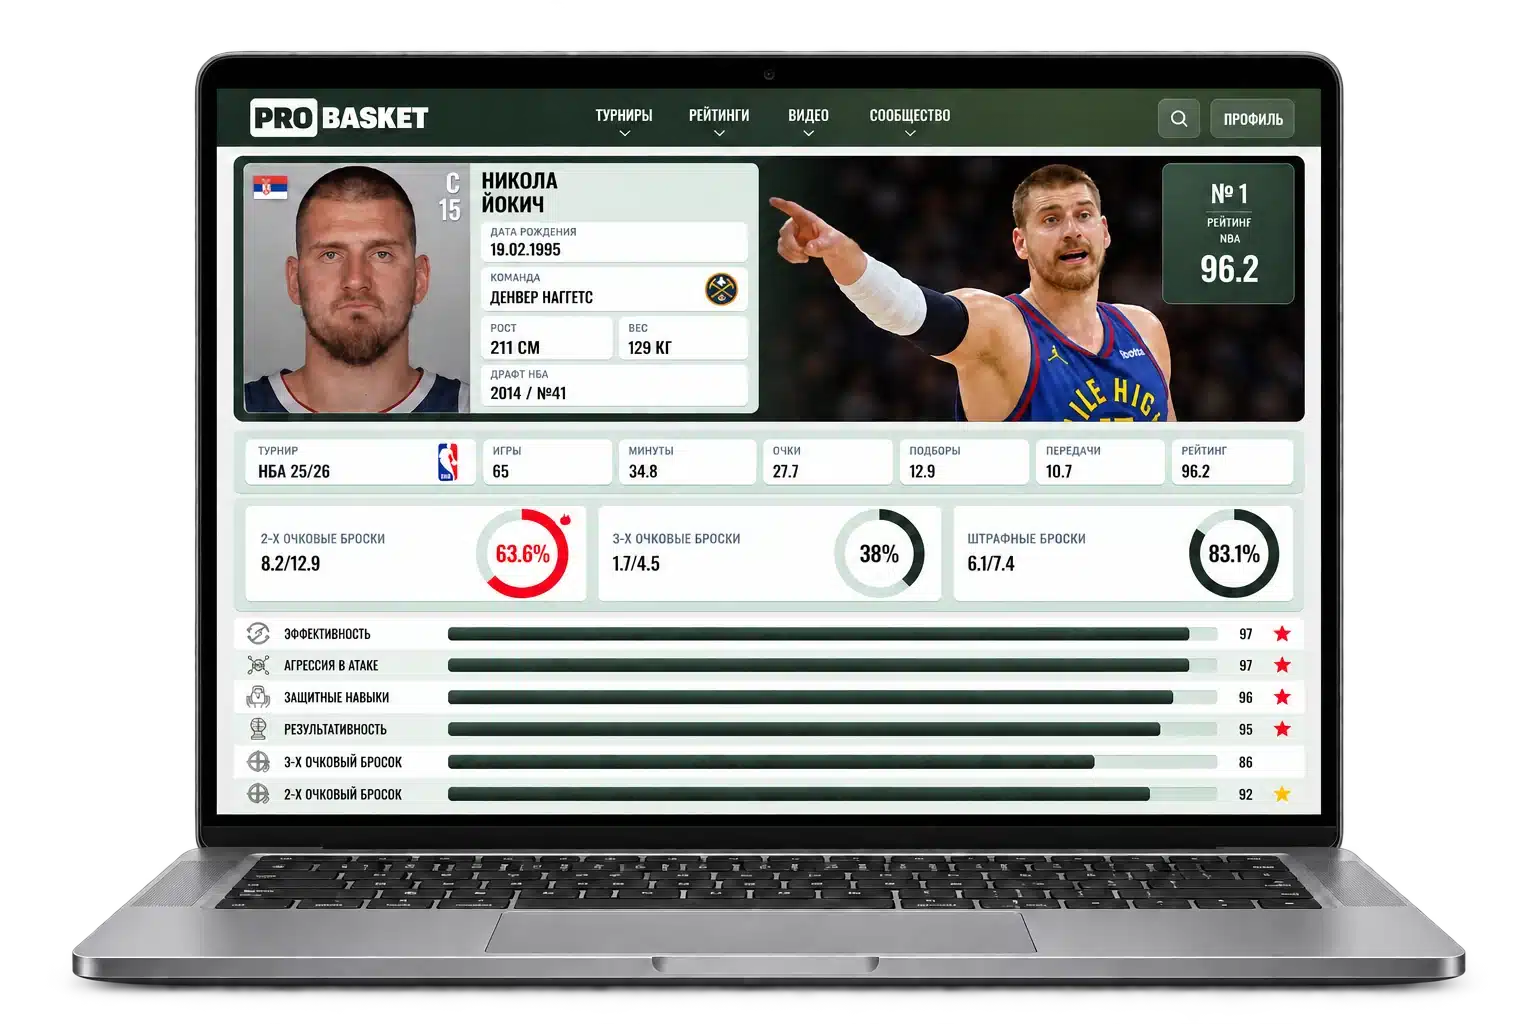
Rating System
Player Ratings

- Ratings
- Description
- Criteria
- Formulas
- Calculation Example
ProBasket Selection
Professional Player Ratings
VTB United LeagueProBasket Selection
Russia Junior Ratings
Russia U23Russia U23
This ranking features Russia's leading under-23 players, born in 2003, 2004 and 2005.
View Ranking
Russia U20Russia U20
This ranking features Russia's leading under-20 players, born in 2006 and 2007.
View Ranking
Russia U18Russia U18
This ranking features Russia's leading under-18 players, born in 2008 and 2009.
View Ranking
Russia U16Russia U16
This ranking features Russia's leading under-16 players, born in 2010 and 2011.
View Ranking
VTB United Youth LeagueVTB United Youth League
This ranking features the leading VTB United Youth League players.
View RankingProBasket Selection
Hall of Fame
NBANBA
The Hall of Fame features the greatest players in National Basketball Association history.
View Hall of Fame
EuroLeague
VTB United LeagueVTB United League
The Hall of Fame features the greatest players in VTB United League history.
View Hall of Fame
RussiaRussia
The Hall of Fame features the leading players in modern Russian basketball history.
View Hall of FameProBasket
About the Rating
ProBasket Rating
Understand the Game
ProBasket ratings convert daily game statistics into clear skill scores. There is no voting or subjective adjustment: positions depend only on current on-court performance. This helps fans understand the game, players identify strengths and development areas, and coaches and analysts compare results consistently.
A shared language of numbers makes basketball more accessible, builds interest in players, teams and competitions, and connects the professional and amateur basketball community.

Statistics Only
The assessment contains no voting, popularity measures or subjective adjustments. Ratings use only game statistics updated daily. Current-season positions therefore change with actual performance.
Ten Indicators
The system separately assesses efficiency, scoring, offensive aggression, defense, rebounding, passing, composure, playmaking, three-point and two-point shooting. Each skill has its own score and interval scale.
Professional Rating Formulas
Each indicator has a separate formula based on basketball logic and tested against real statistical samples. Formulas account for action volume and accuracy, playing time, positive and negative events, using only the data relevant to that skill.
Baseline
The baseline is a shared starting point within each league. It is identical for all players in that ranking and accounts for the competition level. It is not an individual assessment. Individual performance is reflected in a statistical adjustment: the formula result falls into a scale interval that increases or decreases each skill's league baseline.
Interval Scale
The formula result falls within one of 26 continuous intervals. Each corresponds to an adjustment from −10 to +15 points. The numerical formula result is converted into a common scale score and added to or subtracted from the league baseline, allowing consistent comparisons between players.
Ranking Eligibility
A dynamic threshold for games and minutes prevents brief successful spells from distorting the table. Requirements are lenient early in the season and increase with the schedule. The ranking includes players with sufficient, comparable samples.
League Baselines
Baselines by Competition
NBA
EuroLeague
VTB United League
NCAA
SuperLeague
VTB United Youth League
Transparent Methodology
How Statistics Become Ratings
Each step can be explained and checked: the same calculation sequence processes the source statistics for every player in the selected league.
View FormulasBaseline
Sets a common baseline for every player in a league.
Formula
Calculates each skill from the player's season statistics.
Scale Interval
Converts the numerical formula result into an adjustment of −10 through +15 points.
Skill Score
Adds the league baseline and statistical adjustment.
Average of 10 Skills + Confirmed Season Workload Bonus
The bonus depends on games played: a larger confirmed season sample adds a higher bonus to the average skill score. It reflects consistency over time without changing individual skill scores. The overall rating is capped at 99 and recalculated with the statistics.
Try It Yourself
Numbers Should Explain the Game
Consistent formulas and daily data updates compare contributions across positions, roles and playing time without subjective judgments. Positions change with performance, highlighting established leaders as well as role players and young prospects emerging in a new competition. Select a league and indicator to see overall and individual skill scores.
View RankingsProBasket
Rating Criteria
Ten indicators describe different aspects of play. Each is calculated separately from current statistics and receives its own score on a common scale.
Efficiency
Measures overall offensive and defensive contribution through points, rebounds, assists, steals and blocks, with penalties for missed shots and turnovers.
Scoring
Measures scoring consistency relative to time on court, accounting for both scoring volume and scoring pace.
Offensive Aggression
Measures how often a player pressures the defense and finishes possessions, using shots, free throws, assists, offensive rebounds and turnovers.
Defensive Skills
Measures contribution to stopping opposing attacks through defensive rebounds, steals, blocks and fouls, accounting for consistency across different playing time.
Rebounding
Measures the ability to end opposing possessions and create additional attacks. Offensive rebounds receive extra weight.
Passing
Measures sustained assist production relative to time on court. A longer period of creative activity produces a higher score.
Composure
Measures decision-making consistency under offensive workload using free-throw reliability, turnover share and confirmed playing time.
Playmaking
Measures ball-management quality: assists created relative to turnovers. It assesses the reliability and productivity of playmaking.
Three-Point Shooting
Measures long-range shooting using two independent factors: three-point percentage and attempts per game.
Two-Point Shooting
Measures shooting inside the arc using two independent factors: field-goal percentage and attempts per game.
ProBasket
Rating Formulas
Ten Indicators — Ten Separate Calculations
Each formula uses only actions relevant to its skill. The result is converted through scale intervals into an adjustment of −10 to +15 points that changes the relevant league baseline.
Efficiency
(PTS + REB + AST + ST + BS − (FGA − FGM) − (FTA − FTM) − TO) / MPG^0.35Adds positive offensive and defensive actions, then subtracts missed field goals, missed free throws and turnovers. The exponent 0.35 gently accounts for playing time, preserving the value of sustained contributions under a high workload.
Scoring
PTS / MPG^0.65Assesses scoring volume alongside scoring pace. Partial normalization by minutes prevents a short successful stint from automatically outweighing a rotation player's consistent production.
Offensive Aggression
(FGA + 0.44 × FTA + 0.85 × AST + 1.20 × OREB − 0.60 × TO) / MPG^0.50Measures how often a player finishes possessions and pressures the defense. Shots, free throws, assists and offensive rebounds increase the result; turnovers decrease it. Playing time is partially accounted for.
Defensive Skills
(0.40 × DREB + 2.50 × ST + 2.10 × BS − 0.40 × F) / MPG^0.50Uses defensive rebounds, steals, blocks and fouls. Steals receive more weight because they end opposing possessions; the foul penalty reflects defensive discipline.
Rebounding
(REB + 0.35 × OREB) / MPG^0.80Uses all rebounds and gives extra weight to offensive rebounds, which create another possession. Gentle normalization by playing time preserves the advantage of sustained production.
Passing
AST / MPG^0.75Assesses sustained assist production relative to time on court. Turnovers are excluded here: ball-management quality is measured separately by Playmaking.
Composure
1.50 × FT%^2 × FTA^0.50 − 15 × TO / (FGA + 0.44 × FTA + AST + TO + 1) + 0.22 × MPG^0.50The first part assesses free-throw reliability with a confirmed attempt volume. The second subtracts the turnover share of offensive decisions; the third confirms performance through a sustained workload.
Playmaking
AST / (TO + 0.75)Measures assists relative to turnovers. Adding 0.75 stabilizes the calculation and prevents very few turnovers in a limited role from artificially inflating the score.
Three-Point Shooting
Adjustment = clamp( FG3% Accuracy Score + FG3A Volume Score ; −10…+15 )FG3% is converted through the accuracy scale, while three-point attempts per game (FG3A) use a separate volume scale. The scales are independent: their adjustments are added, clamped to −10 through +15, and applied to the league baseline. With no attempts, accuracy is zero.
Two-Point Shooting
Adjustment = clamp( FG2% Accuracy Score + FG2A Volume Score ; −10…+15 )FG2% is converted through the accuracy scale, while two-point attempts per game (FG2A) use a separate volume scale. The scales are independent: their adjustments are added, clamped to −10 through +15, and applied to the league baseline. With no attempts, accuracy is zero.
A Number Becomes a Clear Score
The formula does not directly produce a rating. Its result falls into one of 26 continuous intervals, receives an adjustment from −10 to +15, and changes the league baseline. This compares different roles using consistent, predefined rules.
Formula Notation
All inputs except games played (GP) are per-game averages for the selected season. Percentages are fractions: for example, 0.38 means 38%.
Attacking the Basket
FGMField Goals Made per Game
FGAField Goal Attempts per Game
FTMFree Throws Made per Game
FTAFree-Throw Attempts per Game
FT%Free-Throw Percentage
FG2MTwo-Point Field Goals Made per Game
FG2ATwo-Point Attempts per Game
FG2%Two-Point Percentage
FG3MThree-Point Field Goals Made per Game
FG3AThree-Point Attempts per Game
FG3%Three-Point Percentage
Statistical Indicators
PTSPoints per Game
GPGames Played
MPGAverage Minutes per Game
REBRebounds per Game
DREBDefensive Rebounds per Game
OREBOffensive Rebounds per Game
ASTAssists per Game
STSteals per Game
BSBlocks per Game
TOTurnovers per Game
FFouls per Game
Symbols: × means multiplication, / division, and ^ an exponent. Accuracy and volume scores convert two independent statistical values using separate scales. A clamp limits their sum to −10 through +15.
ProBasket
Rating Calculation Example
Real Data · NBA 2025/26
From Statistics to a Skill Score
Разберём показатель «Защитные навыки» на статистике Луки Дончича. Данные игрока проходят четыре понятных шага: расчёт по формуле, выбор нужной статистики и подстановка значений, попадание в диапазон шкалы и сложение поправки с базовым баллом лиги.
Luka Doncic
№ 7 / PG / 201 cm / 105 kg / 28.02.1999

Date of Birth
Team
Los Angeles Lakers
Height
201 cm
Weight
105 kg
NBA Draft
2018 / №3
Rating
PLAYER
94.5

Statistics 2025/26
Games (G)
64
MINUTES (MPG)
35.8
Points (PPG)
33.5
Defensive Rebounds (DREB)
7.1
Offensive Rebounds (OREB)
0.6
Assists (AST)
8.3
Steals (ST)
1.6
Blocks (BS)
0.5
Fouls (F)
2.4
Turnovers (TO)
4
Step 1 · Formula
Defensive Skills
Что показывает формула. Она описывает защитный профиль игрока: как часто он завершает владение соперника подбором в защите, перехватом или блок-шотом, с учётом фолов и игрового времени. Вес показателя. Подборы в защите имеют вес 0.40, перехваты — 2.50, блок-шоты — 2.10, фолы — 0.40. Разбор формулы. Сначала складываем взвешенные подборы в защите, перехваты и блок-шоты, затем вычитаем штраф за фолы. Сумма в скобках образует числитель. Нормализация по времени. Числитель делится на MPG^0.50 — квадратный корень из среднего игрового времени.
Step 2 · Substitute Data
Select the Statistical Inputs
From the full season statistics, select only the inputs used in the defensive skills formula. Substitute Luka Doncic's per-game averages for the corresponding symbols.
Step 3 · Interval Scale
Identify the Scale Score
Шкала включает 26 непрерывных диапазонов результатов. Им последовательно присваиваются значения от −10 до +15 баллов, включая 0, с шагом 1 балл. Каждому баллу соответствует собственный диапазон результата формулы. Нулевая зона соответствует результату около среднего уровня лиги, отрицательные значения показывают результат ниже него, положительные — выше. Результат формулы 1.158 входит в диапазон 1.063–1.158 и получает +12 баллов.
Step 4 · Skill Score
Add the Baseline and Scale Score
The score of 94 applies only to defensive skills. The player's overall rating of 94.5 uses all ten indicators and the confirmed season workload.
Result on the Player Card
Luka Doncic Rating Calculation
| Efficiency | 97 | |||
| Offensive Aggression | 97 | |||
| Defensive Skills | 94 | |||
| Scoring | 97 | |||
| Three-Point Shooting | 87 | |||
| Two-Point Shooting | 88 | |||
| Passing | 96 | |||
| Rebounding | 86 | |||
| Playmaking | 91 | |||
| Composure | 94 | |||
| Rating | 94.5 | |||
Now Check the Calculation
Every rating value links to published statistics, a formula and a specific scale interval. A player's position therefore changes with actual performance, without voting or subjective adjustments.